Connettiti
 Registrati subito


Sony Q1 FY2019 (April-June) Results - PS4: 3.2m (LTD: 100 million) / 1 billion games sold / FY2019 FCT down to 15m PS4

Sony Corporation - Q1 FY2019 (April - June 2019) :
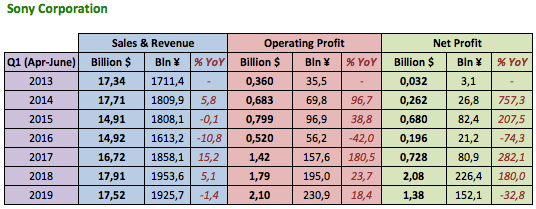
Sony Revenue : ¥1925.7bn / $17.52B (-1.4% YoY from ¥1953.6bn / $17.91B - Q1 FY2018)
Sony Operating Profit : ¥230.9bn / $2.10B (+18.4% YoY from ¥195bn / $1.79B - Q1 FY2018)
Sony Net Profit : ¥152.1bn / $1.38B (-32.8% YoY from ¥226.4bn / $2.08B - Q1 FY2018)
- Best Operating Profit ever for Sony during Q1
- 2nd best Net Profit ever for Sony during Q1
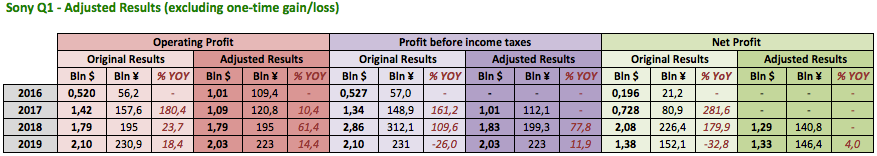
Last Q1, "Profit before income taxes" and therefore "Net profit" were inflated by an extraordinary item (unrealized and realized gains on shares of Spotify [+112.8 bln yen, net / $1.03B]).
Here's a table with Adjusted Results excluding one-time gain/loss, compared to Original Results
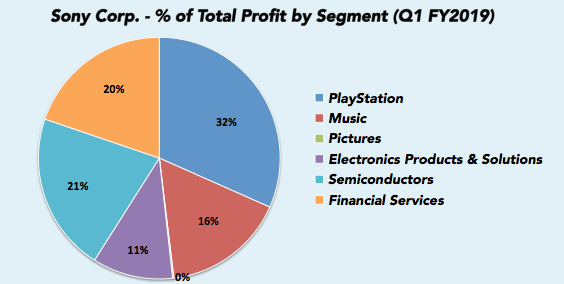
Top of Biggest Profit Drivers for the Quarter (% of Total Profit) :
- Game & Network Services : ¥73.8bn / $0.672B (32%)
- Semiconductors : ¥49.5bn / $0.450B (21.4%)
- Financial Services : ¥46.1bn / $0.419B (20%)
- Music : ¥38.3bn / $0.348B (16.6%)
- Electronic Products & Solutions : ¥25.1bn / $0.228B (10.9%)
- Pictures : ¥0.4bn / $0.004B (0.2%)

Gaming Division - Q1 FY2019 Results (April - June 2019) :

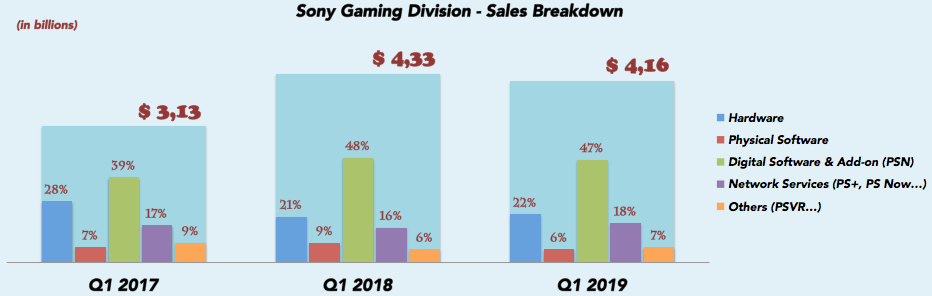
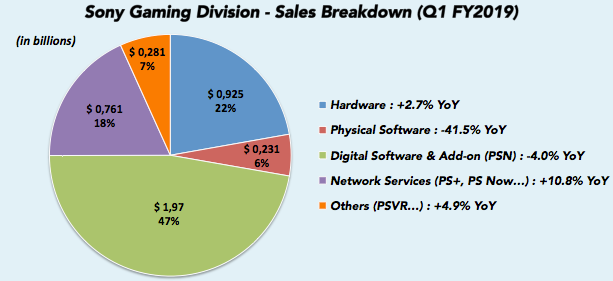
Gaming Revenue : ¥457.5bn / $4.16B (-3.1% YoY from ¥472.1bn / $4.33B - Q1 FY2018)
Gaming Operating Profit : ¥bn / $0.672B (-11.6% YoY from ¥83.5bn / $0.765B - Q1 FY2018)
- 2nd best Revenue and Operating Profit ever for PlayStation during Q1
This quarter, the Gaming Division accounts for :
- 23,8% of Sony total Sales/Revenue (vs 24.2% - Q1 FY2018)
- 32% of Sony total Operating Profit (vs 42.8% - Q1 FY2018)
PS4 shipped : 3.2m (vs 3.2m - Q1 FY2018)
PS4 LTD : 100m
Software sold : 42.9m (vs 40.6m - Q1 FY2018)
Software digital ratio : 53% (vs 43% - Q1 FY2018)
PS+ Members : 36.2m (up from 33.9m - Q1 FY2018)
Therefore, at least 1 billion games have been sold since PS4 launch
PS4 shipments : 15m (down from 16m - April 2019 forecast)
 Torna su